
COLUMN GRAPHS
When bar graph is represented using vertical bars, it is also called a column graph.
(a) The following graph shows the waking up time of the students of Class V on Sunday mornings.
Study the graph to answer the questions
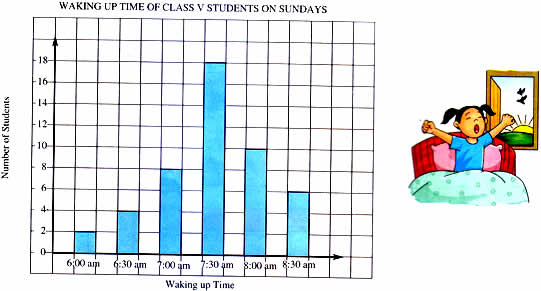
Like in a bar graph, it is important to understand both the scales and see what quantity each square represents. Here each square stands for 2 students.
In a column graph it is easier to begin by reading the horizontal scale first, for example ‘7:00 am’ and go up the column to see where the column ends. The column above 7:00 am ends at the corresponding vertical scale at 8. This means that 8 children woke up at 7:00 am.
A double column graph can show even more information.
(b) The data shows a comparison between the number of refrigerators and air conditioners sold in a particular shop in six months.
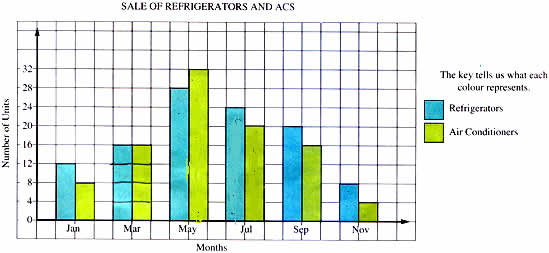
When we use a column graph like this we can compare information in even more detail. For example, the graph shows us that the same number of ACs were sold in the months of March and September, but there were 4 more refrigerators sold in the month of September than March.