PICTOGRAPHS
- Pictograph use pictures or symbols to represent information.
- It has a title.
- It gives the definition of the symbol or the key. The key is defined such that it represents the entire data.
- pictographs help you understand the information by allowing you to compare the data shown.
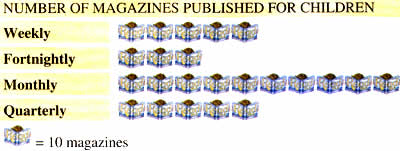
(a) The table shows the number of magazines published for children.
Weekly magazines
50
Fortnightly magazines
30
Monthly magazines
100
Quarterly magazines
50
This pictograph shows the same information.
(b) Represent the following information in the form of a pictograph. Give the pictograph a title and show what your symbol stands for
Favorite TV channels in Class V:
Comedy – 15 children, Cartoons – 25 children, Sports – 10 children, Adventure – 5 children.