BAR GRAPHS
Another way to represent data is to show it in the form of bar graphs.
- Bar graphs represent numerical information with the help of columns or bars.
- It has a title explaining the information given in the graph.
- It has horizontal and vertical scales with labels explaining the scales.
(a) Class V children voted on where they would like to go for their class picnic.
Beach – 12 voted
Garden – 8 votes
Adventure Park – 22 votes
Zoo – 18 votes
This data can be shown as a horizontal bar graph. Here each square represents two votes.
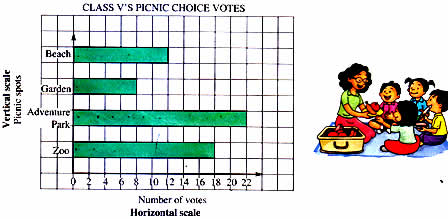
In a bar graph, it is easier to first read what is on the vertical scale – for example, ‘beach’. Then from the point where the bar related to related to beach ends, go downwards to the horizontal scale to read the number –
12 student. This tells us that 12 students voted for beach as their choice for a picnic.
(b) Given below are the marks that Srinivas got in four maths tests. The testes were of 50 marks.