CIRCLE GRAPHS
Circle graphs or pie graphs, as they are also called, represent data by dividing up a circle into various sections that can be compared.
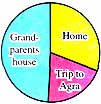
(a) This circle graph shows where Shubada spent her summer vacations.
- Where did Shubada spend the maximum number of days of her vacation?
- Where did she spend the least number of days?
- Was she at her home more or less than at her grandparents’ house?
(b) The table shows the hobby classes that the students choose for the term. The circle graph should shows the same information.
Circle graphs shows all the parts of a whole.
Here whole consists of all the 24 students of Class V.
What is the total number of students shown in the graph? _______
1. 12 out of the 24 is 12/24 or 1/2 of the students have opted for music. That is half the students have opted for music. So, 1/2 of the circle has been colored to show the information.

2. 6 out of the 24 is 6/24 or 1/4 of the students have opted for art. So, 1/4 of the circle has been colored to show the information.

3. 3 out of the 24 is 3/24 or 1/8 of the students have opted for gardening. So, 1/8 of the circle has been colored to show the information.

4. 3 out of the 24 or 1/8 of the students opted for sewing. So, 1/8 of the circle has been colored to show the information.

This is the completed circle graph.